Last reviewed: April 2026 | Written by Michael R. Hayes, Productivity Consultant
Most managers think they know how productive their team is.
They’re usually wrong — not by a little, but by a wide margin. Research from Harvard Business Review found that managers who rated their team’s productivity without data were accurate less than 60% of the time. The rest were either underestimating high performers or carrying low performers far longer than they realised.
The fix isn’t a better instinct. It’s a number.
This guide shows you exactly how to calculate employee productivity — with a formula you can use in a spreadsheet, a calculator you can use right now, and real examples from five different industries. If you manage people and you’re not measuring output per hour, you’re making expensive decisions based on gut feel.
What Employee Productivity Actually Measures
Employee productivity is the ratio of output to input, measured at the individual level.
In plain terms: how much does one person produce for every hour you pay them?
The core formula:
Employee Productivity = Total Output ÷ Total Hours Worked
Output can be almost anything meaningful to your business:
- Units produced on a manufacturing line
- Revenue generated by a salesperson
- Tickets resolved by a support agent
- Billable hours completed by a consultant
- Jobs completed by a field technician
- Patients treated by a healthcare clinician
Hours worked is just that — the total hours clocked, including any overtime, but typically excluding unpaid breaks.
The result gives you a per-hour productivity rate for any individual, team, or department.
Why a Simple Percentage Misses the Point
Many managers confuse productivity with efficiency — they’re related but different, and conflating them leads to bad decisions.
Productivity measures how much you produce. It’s about volume of output relative to input.
Efficiency measures how well you use your resources. A highly efficient process with poor output is still failing.
A sales rep who closes 30 deals in a month by calling 3,000 prospects has a conversion efficiency of 1%. A rep who closes 25 deals by calling 800 prospects has a 3.1% conversion efficiency. The first rep looks more productive by raw output, but the second rep is dramatically more efficient.
Which one would you rather have on your team?
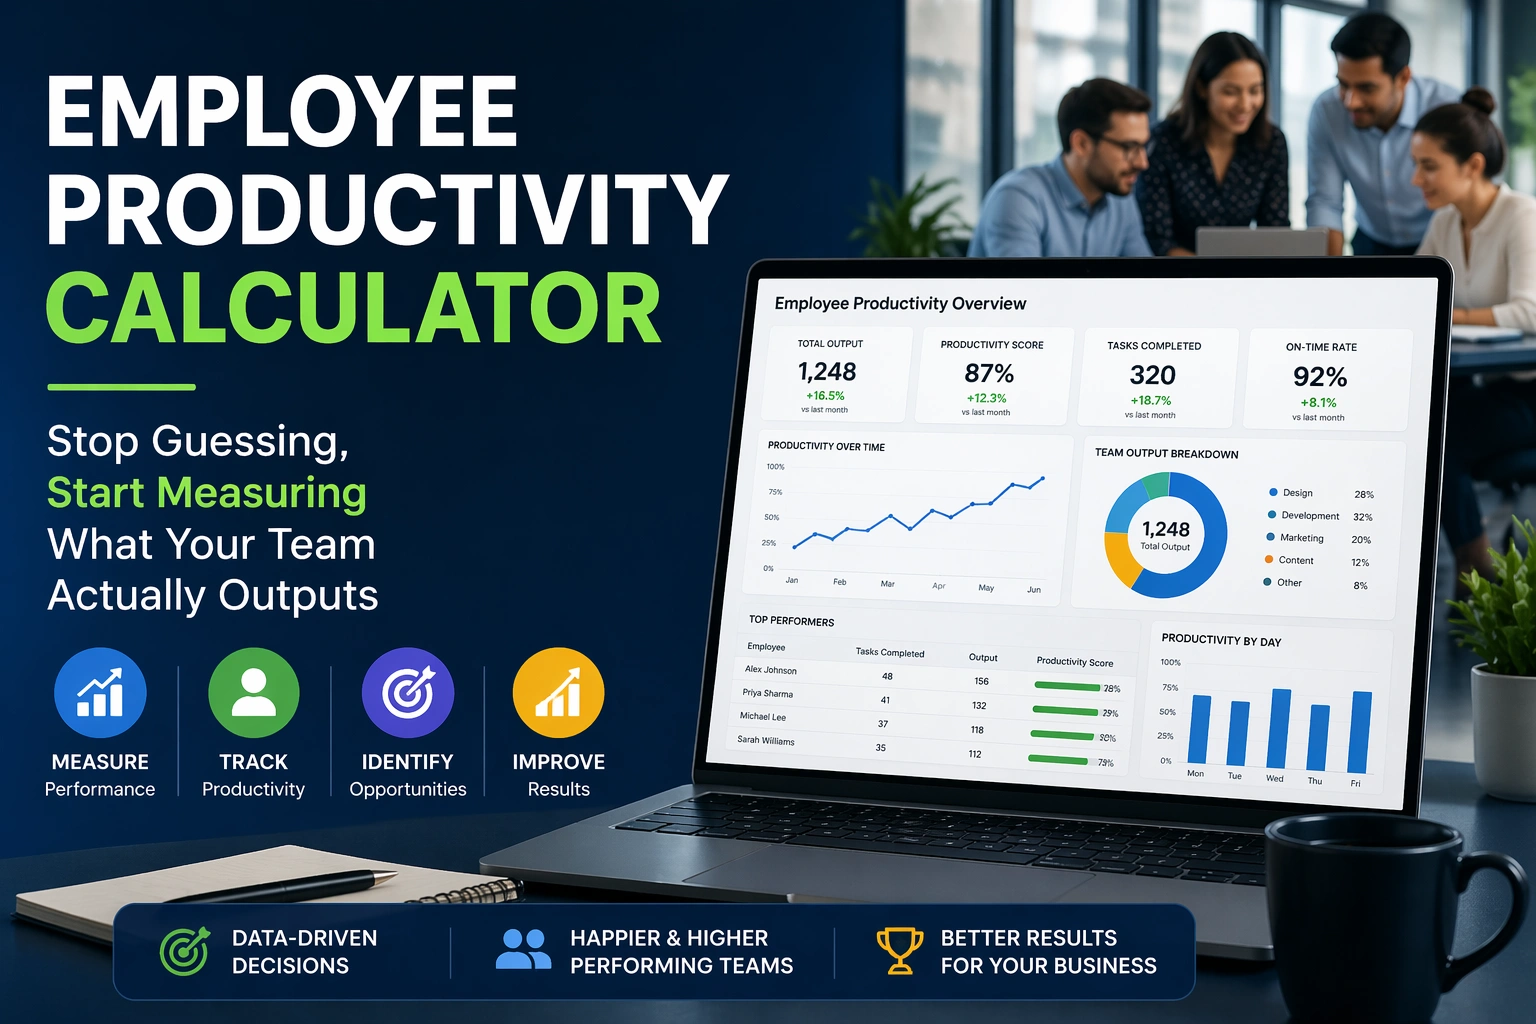
The answer is both — tracked separately. Our free employee productivity calculator lets you measure time-based productivity, team productivity, and output-based productivity in one place, so you’re not comparing apples to oranges when you look at your team’s numbers.
How to Calculate Employee Productivity: Five Real-World Examples
Example 1 — Sales Team
A sales team of four reps generates $380,000 in revenue during a 4-week month. Each rep works 160 hours.
Total labor hours = 4 × 160 = 640 hours
Employee Productivity = $380,000 ÷ 640 = $593.75 revenue per labor hour
Now you can benchmark this against last month, last quarter, or industry averages. If a competitor is generating $700 per labor hour, you know the gap and you can investigate the cause.
Example 2 — Customer Support Team
A support team of six agents resolves 1,440 tickets in a week. Each agent works 40 hours.
Total labor hours = 6 × 40 = 240 hours
Employee Productivity = 1,440 ÷ 240 = 6 tickets per labor hour
If your target is 8 tickets per labor hour, you’re 25% below target. That’s a number you can act on — by investigating whether tickets are too complex, whether training is needed, or whether your staffing model needs adjustment.
Example 3 — Manufacturing
A production team of 10 workers produces 2,200 units during an 8-hour shift. Two workers are on break rotation at any given time, so effective working labor is 8 workers × 8 hours = 64 effective labor hours.
Employee Productivity = 2,200 ÷ 64 = 34.4 units per labor hour
Example 4 — Individual Employee Tracking
You have a project manager who works 45 hours a week. During that week she completes 18 deliverables (reports, presentations, approvals).
Employee Productivity = 18 ÷ 45 = 0.4 deliverables per hour
That means each deliverable takes on average 2.5 hours. Whether that’s good depends entirely on deliverable complexity — which is why baseline tracking over time matters more than any single number.
Example 5 — Remote Team with Variable Hours
A content team has five writers. Over a two-week sprint, the team logs combined hours of 310 and publishes 62 articles.
Employee Productivity = 62 ÷ 310 = 0.2 articles per hour, or 5 hours per article
You can now compare this to your content cost per article and make a data-driven decision about whether to expand the team, bring in freelancers, or invest in better tools to cut that 5-hour average.
The Productivity Calculator with Lunch Break: Why It Matters
One detail that trips up a lot of managers — especially those calculating individual daily productivity — is whether to include break time in the denominator.
If you’re measuring a full shift against output, you have two choices:
Option A — Use total shift time. An employee clocks in at 9am and out at 6pm. That’s 9 hours. Their output is measured against 9 hours. Their productivity percentage will look lower because 30–60 minutes of that window was a lunch break.
Option B — Deduct breaks. Same employee, same shift. You deduct the 30-minute lunch break. Their “effective time” is 8.5 hours, and their productivity is measured against 8.5 hours. The number looks higher.
Neither is wrong — but you need to be consistent across your whole team or your comparisons are meaningless.
Our free productivity calculator includes a dedicated lunch break / break deduction field so you can choose whichever method your organisation uses and get a consistent number across all employees. The HR and Business mode goes further — you can enter total output, total input, and a time period to get a clean output-per-resource figure without worrying about shift structures at all.
The key principle: whatever method you use this week, use the same method next week.
How to Calculate Staff Productivity as a Percentage
Sometimes a raw output-per-hour number isn’t what you need. You need to know whether an employee is hitting a target percentage — particularly common in service businesses, healthcare settings, and any role where time is the product.
The percentage formula:
Productivity % = (Actual Productive Hours ÷ Available Hours) × 100
Example:
An employee is available for 8 hours. After accounting for meetings, admin time, and breaks, she spends 5.5 hours on productive, output-generating work.
Productivity % = (5.5 ÷ 8) × 100 = 68.75%
If your target is 75%, she’s 6.25 percentage points short. You can also reverse this calculation — if your target is 75% and she works an 8-hour shift, she needs 6 hours of productive output.
Productive Hours Required = (Target % ÷ 100) × Available Hours
Productive Hours Required = (75 ÷ 100) × 8 = 6 hours
The Individual mode in our free productivity calculator does both calculations automatically. Enter your shift times, break duration, and either your actual productive hours or your target percentage — and the calculator returns whichever output you need.
Tracking Team Productivity vs. Individual Productivity
Individual tracking and team tracking answer different questions, and good managers use both.
Individual productivity tells you about performance distribution. In any team of ten, you’ll typically find two or three high performers driving a disproportionate share of output, five or six performing near average, and one or two consistently below target. You can’t see this distribution without individual data.
Individual data also tells you whether a productivity problem is structural or personal. If one person is underperforming but everyone else is fine, that’s a coaching or role-fit conversation. If everyone is below target, that’s a systems, resourcing, or management problem — and blaming individuals is the wrong response.
Team productivity tells you about capacity and scalability. If your team produces 6 units per labor hour now, and your growth target requires 9 units per labor hour in six months, you either need to improve processes, add headcount, or revise the target. Team-level numbers make this planning conversation possible.
The Team mode in our productivity calculator handles up to 20 members simultaneously. You can enter each team member’s hours and productive output, and the calculator returns both individual percentages and the team average — all in one screen.
Time Efficiency Calculator: Measuring the Quality of Working Hours
There’s a difference between hours logged and hours actually spent on meaningful work.
The time efficiency calculation answers: of the time your employees are present and available, how much of it generates genuine output?
Time Efficiency % = (Productive Hours ÷ Total Available Hours) × 100
This is structurally the same as the productivity percentage formula, but it’s most useful when you’re investigating a specific problem — for example, why a team’s output has dropped even though no one has reduced their working hours.
Common culprits when time efficiency falls without headcount changes:
Meeting creep. Every meeting that isn’t strictly necessary takes an hour of productive capacity off the table. A team of eight attending a one-hour meeting that could have been an email loses eight productive hours in one go. Track meeting hours as a separate category and you’ll often find the source of efficiency drops quickly.
Context switching. Employees who are constantly interrupted or switching between unrelated tasks produce less per hour than those with protected deep-work time. Research from the American Psychological Association estimates that switching tasks can reduce productive output by up to 40% due to “attention residue” — the mental cost of leaving one task unfinished while starting another.
Tool and process friction. Outdated software, unclear workflows, and redundant approval processes all add non-productive time that shows up nowhere in a headcount report but everywhere in a productivity calculation. If your time efficiency is declining quarter-over-quarter without staffing changes, process friction is usually the first place to look.
Use our productivity calculator to establish your baseline time efficiency number, then track it monthly. Declining numbers before any headcount change are almost always a process or environment problem — and that’s fixable.
What Is a Good Employee Productivity Rate?
There’s no universal benchmark because output varies so widely between industries, roles, and business models. But there are useful reference points.
For time-based productivity percentage — what proportion of available time is spent on productive output — a realistic target range for most knowledge workers is 60–75%. Studies on workplace productivity consistently find that the average knowledge worker is genuinely productive for around 3 hours out of an 8-hour workday, with the rest consumed by meetings, interruptions, administrative tasks, and low-value activities.
This doesn’t mean 3 hours is acceptable — it means uncovering that number is the first step to improving it.
For output-based productivity, benchmarks are entirely industry-specific:
| Role | Typical output measure | Realistic benchmark |
|---|---|---|
| Sales representative | Revenue per hour | Varies enormously by deal size |
| Customer support | Tickets per hour | 5–10 for standard queries |
| Software developer | Story points per sprint | Team-relative, not absolute |
| Healthcare clinician | Billable hours per shift | 65–85% depending on setting |
| Warehouse operative | Units picked per hour | 60–120 depending on operation |
| Content writer | Words per hour | 300–600 for quality long-form |
The most useful benchmark is always your own historical average. Set your baseline now, track it consistently, and measure improvement against that — not against industry figures that may reflect entirely different working conditions.
FAQ
What is the best way to calculate employee productivity?
Use output divided by labor hours for an objective, role-specific number. For time-based roles, use (productive hours ÷ available hours) × 100 to get a percentage. The right method depends on whether your team’s output is more naturally measured in units, revenue, or time.
How do I calculate productivity percentage for an employee?
Divide actual productive hours by total available hours, then multiply by 100. For example: 6 productive hours out of an 8-hour shift = (6 ÷ 8) × 100 = 75%.
Should I include lunch breaks when calculating productivity?
You can either include them (use total shift time as the denominator) or exclude them (deduct break time first). What matters is consistency — use the same method for every employee so your comparisons are valid.
What is a realistic productivity percentage for employees?
For knowledge workers, a genuine productive output rate of 60–75% of available time is typical. For more output-structured roles like manufacturing or healthcare, targets of 70–90% are common.
How often should employee productivity be measured?
Weekly for operational teams, monthly for trend analysis, quarterly for strategic review. Consistency matters more than frequency — a weekly measure taken every week for a year tells you far more than a detailed annual review.
Can I measure a remote team’s productivity with a calculator?
Yes — the output-based and team modes work equally well for remote teams. Input total output (tasks, revenue, units) and total hours logged across the team, and the calculator returns productivity per labor hour regardless of where people are working.
Calculate your team’s numbers right now with the free employee productivity calculator — covers individual, team, and HR/business modes. No signup, no download, works on any device. For role-specific productivity measurement in healthcare settings, see the therapy productivity calculator. For workforce efficiency measurement at a macro level, see the labor productivity calculator.