👉 Use the calculator below, or scroll down for the formula, worked examples, industry benchmarks, and a full explanation of what the numbers mean.
Track and Measure Work Efficiency
Compare the expected (standard) time for a task against how long it actually took. Common in manufacturing, project management, and operations.
Measure how much of a working shift was spent on productive or billable output. Ideal for healthcare, retail, field services, and any shift-based role.
Measure aggregate efficiency across a department or team. Enter total hours across all staff.
When your team is busy all day but output doesn’t match the hours, the problem isn’t effort — it’s how time is being tracked. A time efficiency calculator tells you exactly what percentage of available working time is being converted into productive output, so you can see the gap and close it.
This free tool covers three methods: standard hours vs. actual hours (used in manufacturing and project management), shift-based productive time (used in healthcare, retail, and service roles), and team-level efficiency across multiple staff. No signup, no download, results in under 60 seconds.
What Is Time Efficiency?
Time efficiency measures how well available working time is converted into productive output. It answers a question most managers ask instinctively but rarely calculate: of the hours we’re paying for, how many are actually being used productively?
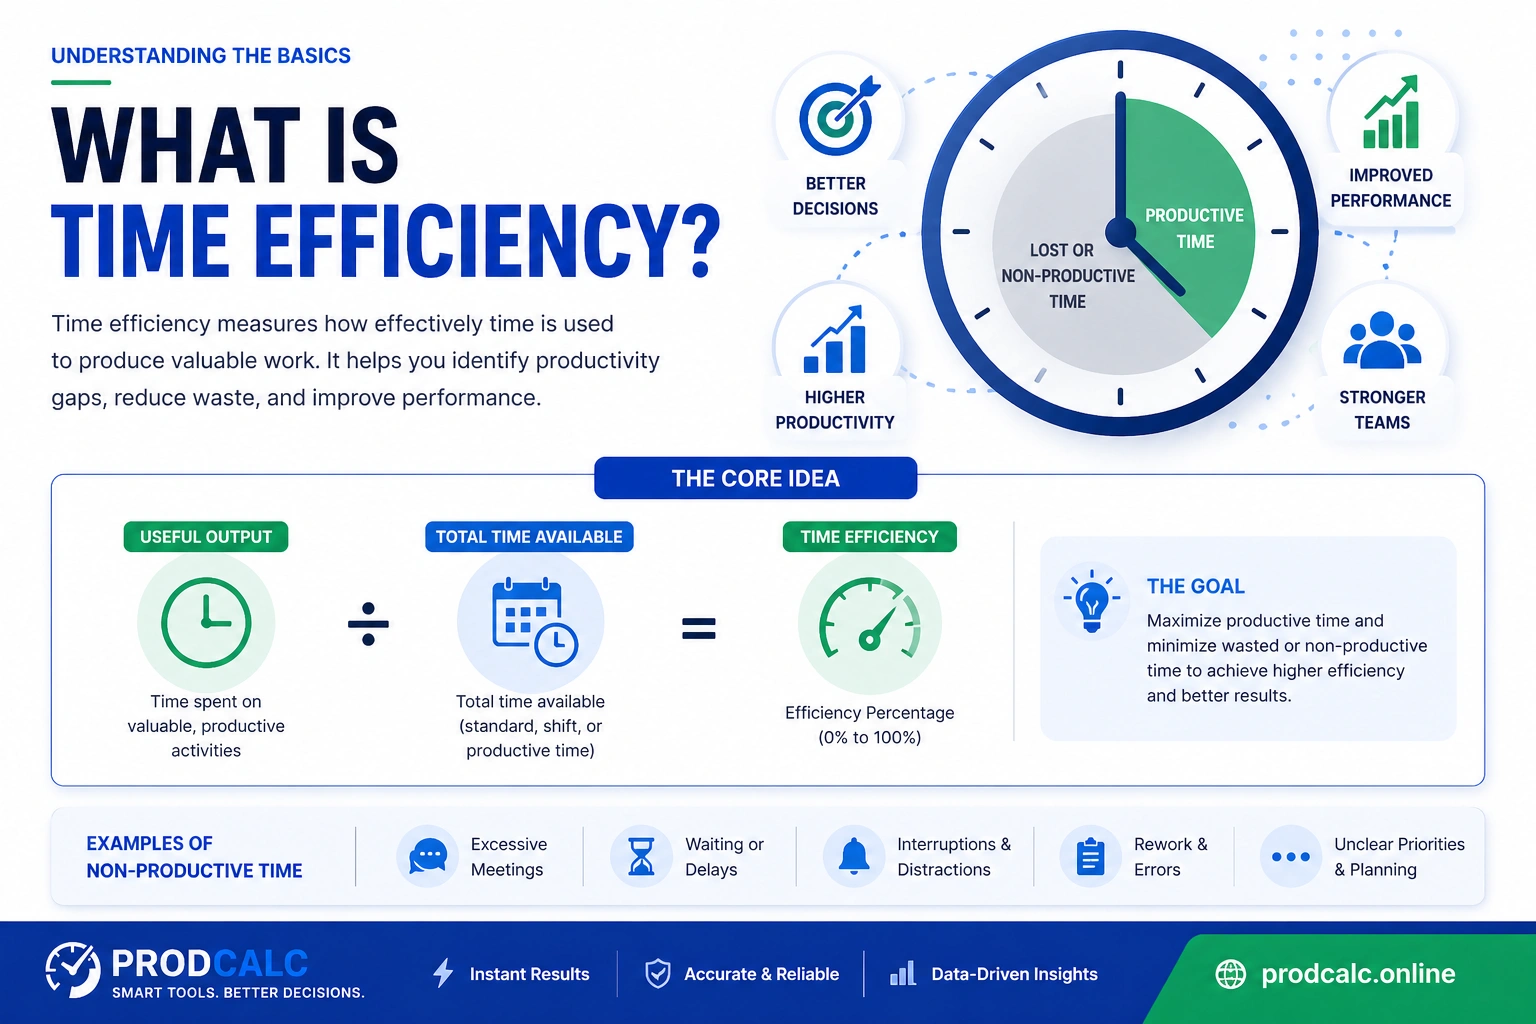
It is different from productivity, even though the two are often used interchangeably. Productivity measures the volume of output per hour worked. Time efficiency measures how much of your available time is spent generating that output in the first place. Both are worth tracking — they diagnose different problems.
A team can be highly efficient with their working time yet produce low output if they are slow or undertrained. Conversely, a team can generate strong output in the hours they do work while wasting a large portion of the available shift. Knowing both numbers tells you which problem you’re actually dealing with.
The Time Efficiency Formula
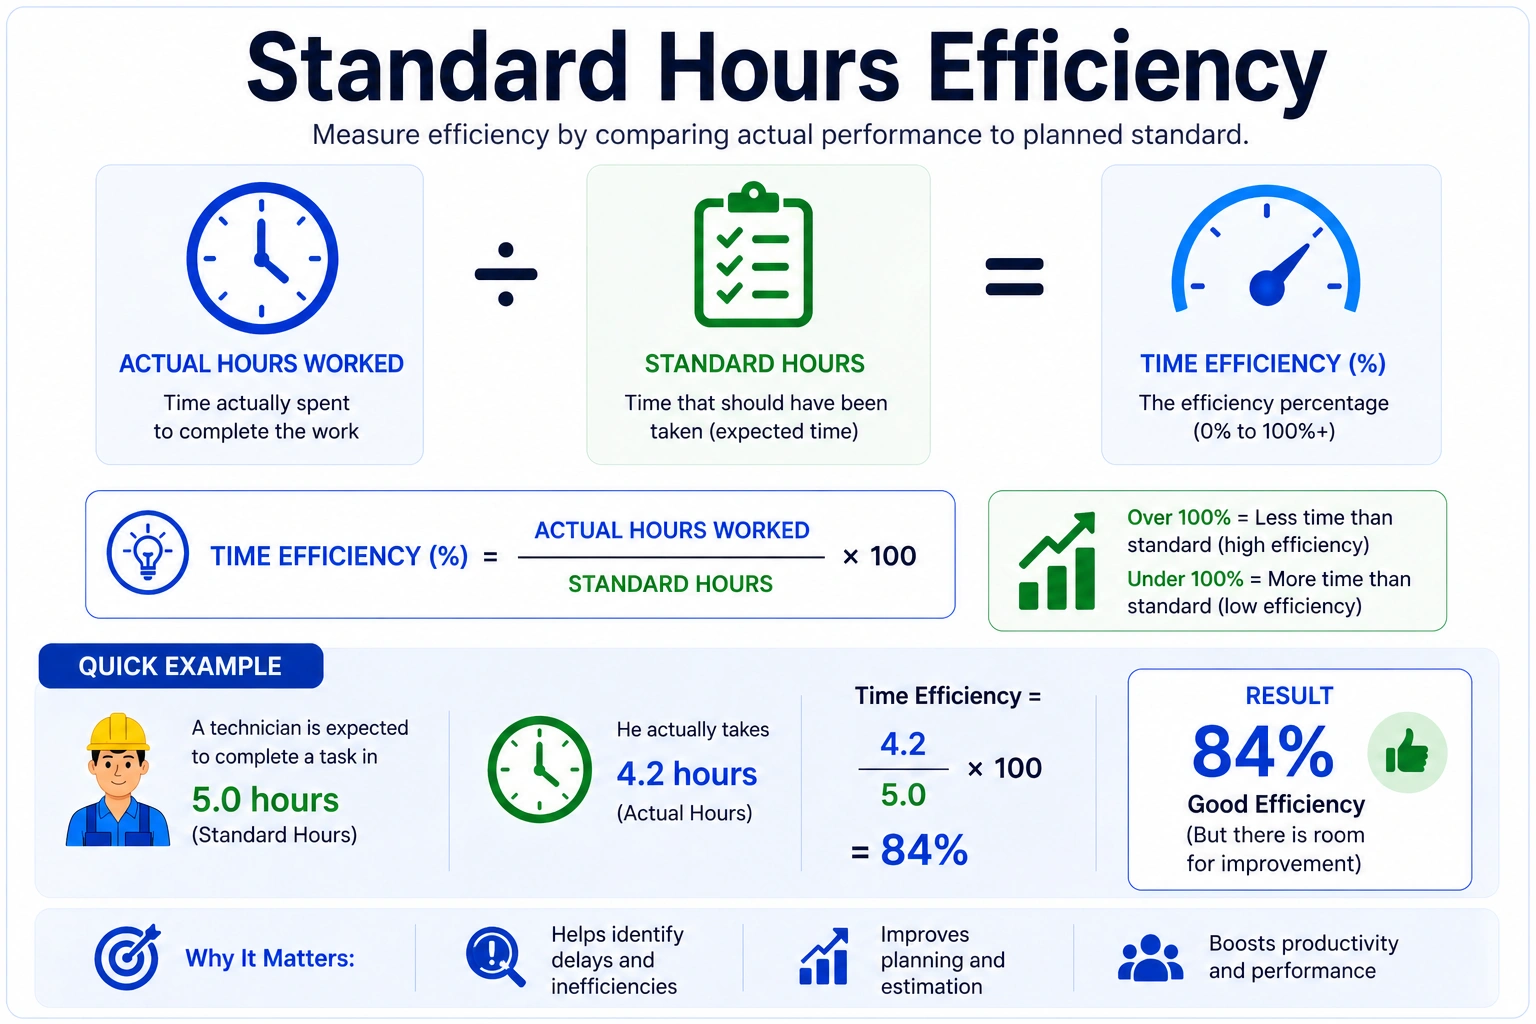
There are two versions depending on what you are measuring. The first compares estimated time against actual time. The second compares productive time against available time. Both are straightforward — the difference is which question you are answering.
Method 1 — Standard Hours vs Actual Hours
Used in manufacturing, construction, and project-based work where tasks have a predefined time budget.
Method 2 — Productive Hours vs Available Hours
Used in healthcare, retail, hospitality, and shift-based roles where the focus is on how much of a shift was spent on direct output work.
Worked Examples
Example 1 — Project delivery (Standard Hours Method)
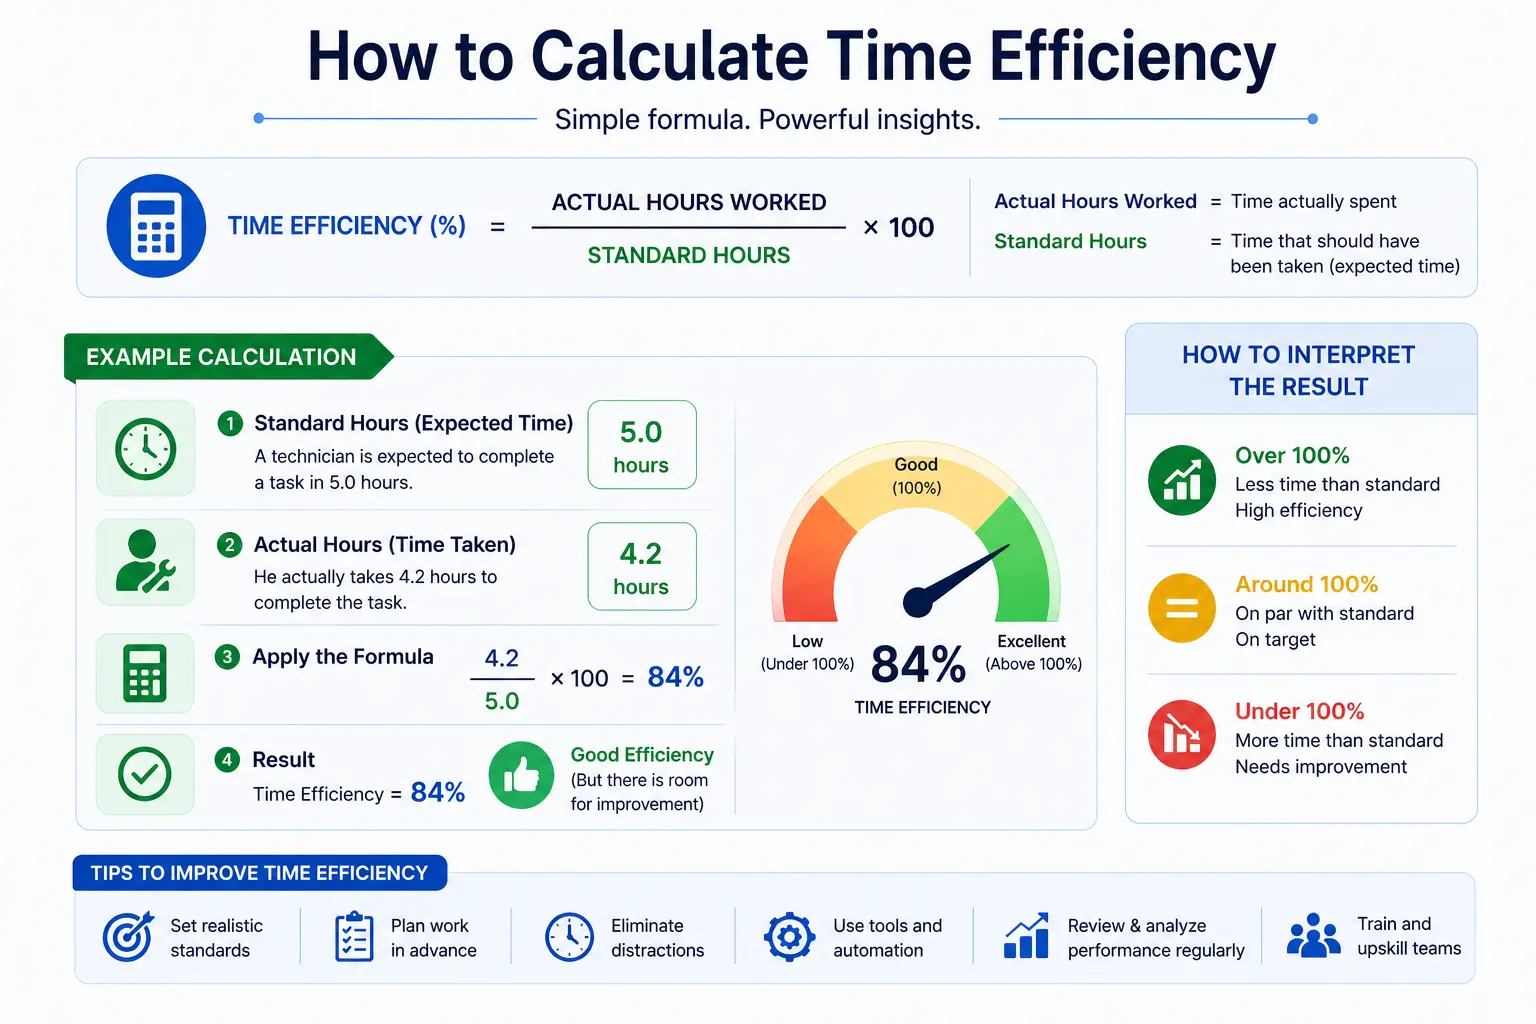
A software team was given a 40-hour estimate for a feature build. It took 50 hours to complete.
Time Efficiency = 0.80 × 100
Time Efficiency = 80%
The project took a quarter longer than planned. Whether this signals poor estimation, scope creep, or team blockers is the next question to answer — but the number tells you exactly where to start.
Example 2 — Healthcare clinician (Shift Method)
A physical therapist assistant works an 8-hour shift (480 minutes). Lunch is 30 minutes. Five treatment sessions totalling 300 minutes are completed.
Time Efficiency = (300 ÷ 450) × 100
Time Efficiency = 66.7%
150 minutes of the shift were non-productive. That gap could be documentation time, a patient no-show, team meetings, or transition time between appointments. The number tells you there’s a gap — investigating the cause determines the fix. Use the therapy productivity calculator if you work in a clinical setting and need role-specific targets.
Example 3 — Manufacturing batch (Standard Hours Method)
A production team was allocated 200 standard hours for a batch. They completed it in 180 actual hours.
Time Efficiency = 1.111 × 100
Time Efficiency = 111.1%
With the standard hours method, results over 100% are not only possible — they’re desirable. The team finished 11% faster than the standard predicted. This is useful data for recalibrating future estimates and recognising strong performance.
Example 4 — Remote knowledge worker team (Shift Method)
A content team of six works 37.5-hour weeks. Combined, they log 225 available hours in a week. After accounting for meetings, admin, and breaks, they spend 148 hours on actual content production.
Time Efficiency = 65.8%
Per person average: 148 ÷ 6 = 24.7 productive hours out of 37.5 available
For a remote knowledge-work team, 65–70% time efficiency is realistic — meetings, communication overhead, and task-switching account for the rest. The question is whether this has been stable, improving, or declining over the past quarter.
Time Efficiency Benchmarks by Role and Industry
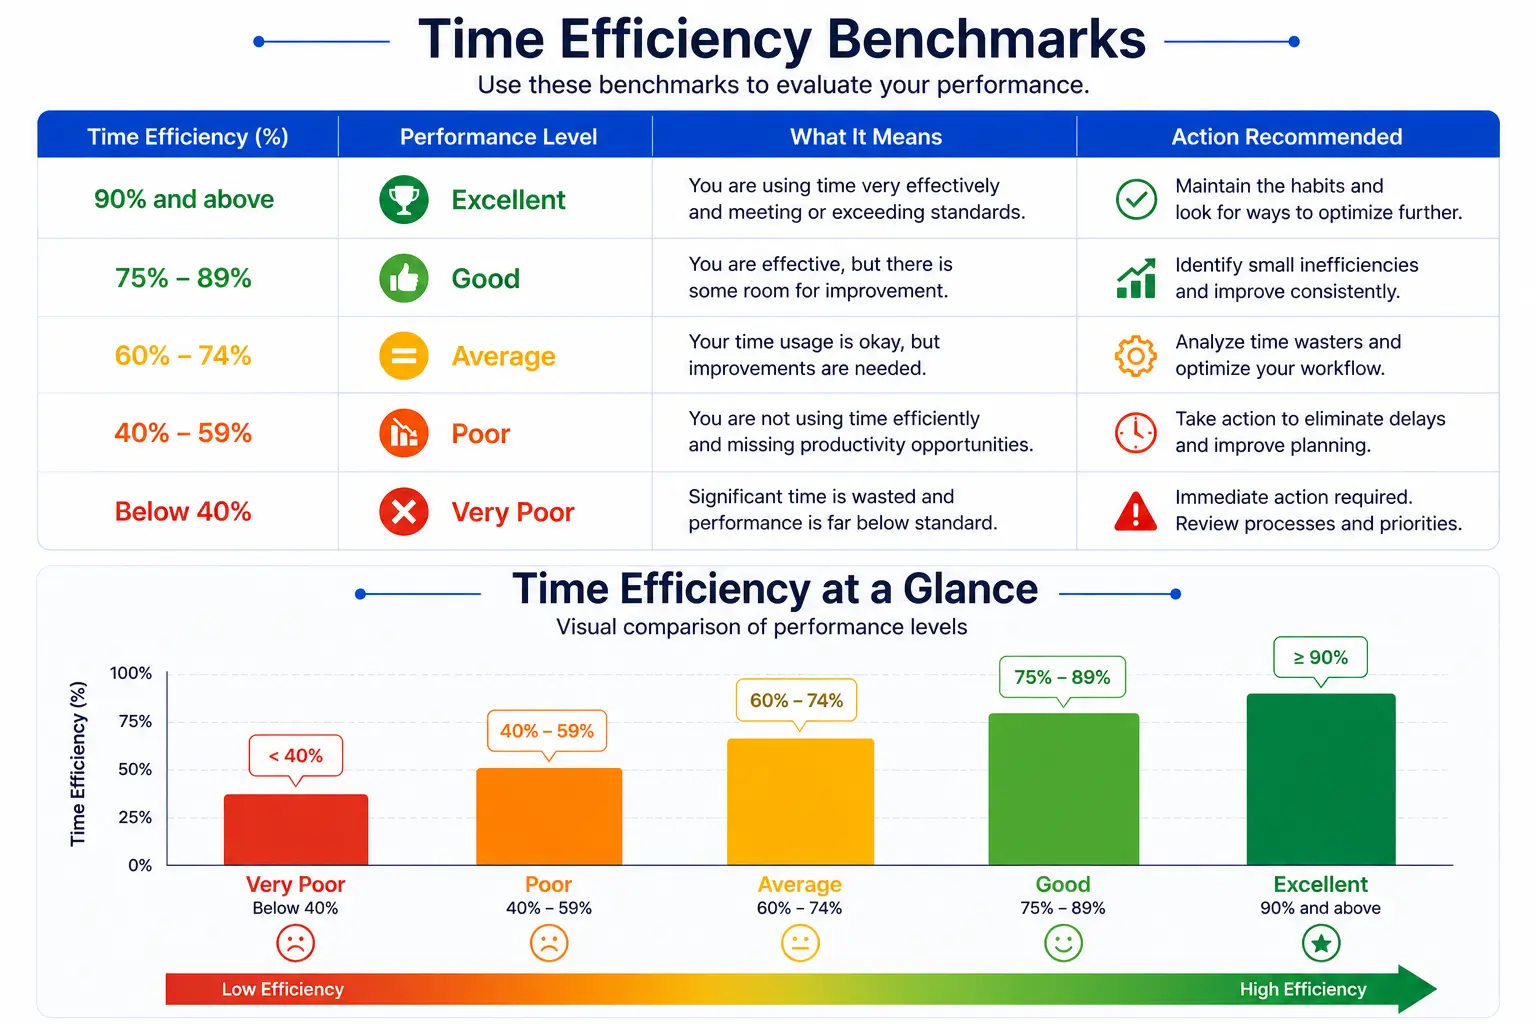
There is no universal “good” percentage. What counts as strong performance depends entirely on the role, the measurement method used, and the setting. The table below gives realistic ranges to use as a starting point — then build your own baseline over time.
| Role / Industry | Method | Typical Target | Key notes |
|---|---|---|---|
| PT / PTA — outpatient clinic | Shift (productive ÷ available) | 70–80% | Cancellations and no-shows are the main drag on outpatient efficiency |
| PT / PTA — skilled nursing facility | Shift (productive ÷ available) | 85–92% | Higher target because patients are in-house; no travel or waiting room delays |
| Knowledge worker (office or remote) | Shift (productive ÷ available) | 60–75% | Meetings, email, and context-switching account for 25–40% of most knowledge workers’ days |
| Manufacturing / production | Standard hours method | 90–115% | Results over 100% are normal and desirable in efficient operations |
| Field service technician | Shift (billable ÷ total) | 65–80% | Travel time and dispatch gaps reduce billable percentage significantly |
| Retail / customer-facing | Shift (productive ÷ available) | 60–75% | Quiet periods, restocking, and customer flow variability reduce the floor |
| Construction (direct labour) | Shift (productive ÷ available) | 50–65% | CIOB data shows many UK construction sites achieve below 50% effective work time on site |
| Software developer | Standard hours (sprint estimate vs actual) | 70–85% | Context switching between tasks and unplanned interruptions are the primary killers |
| Warehouse / fulfilment | Standard hours (pick rate target vs actual) | 85–100% | Highly measurable environment — most operations set tight standard-hours targets per pick |
Why Time Efficiency Drops — and What to Actually Look For
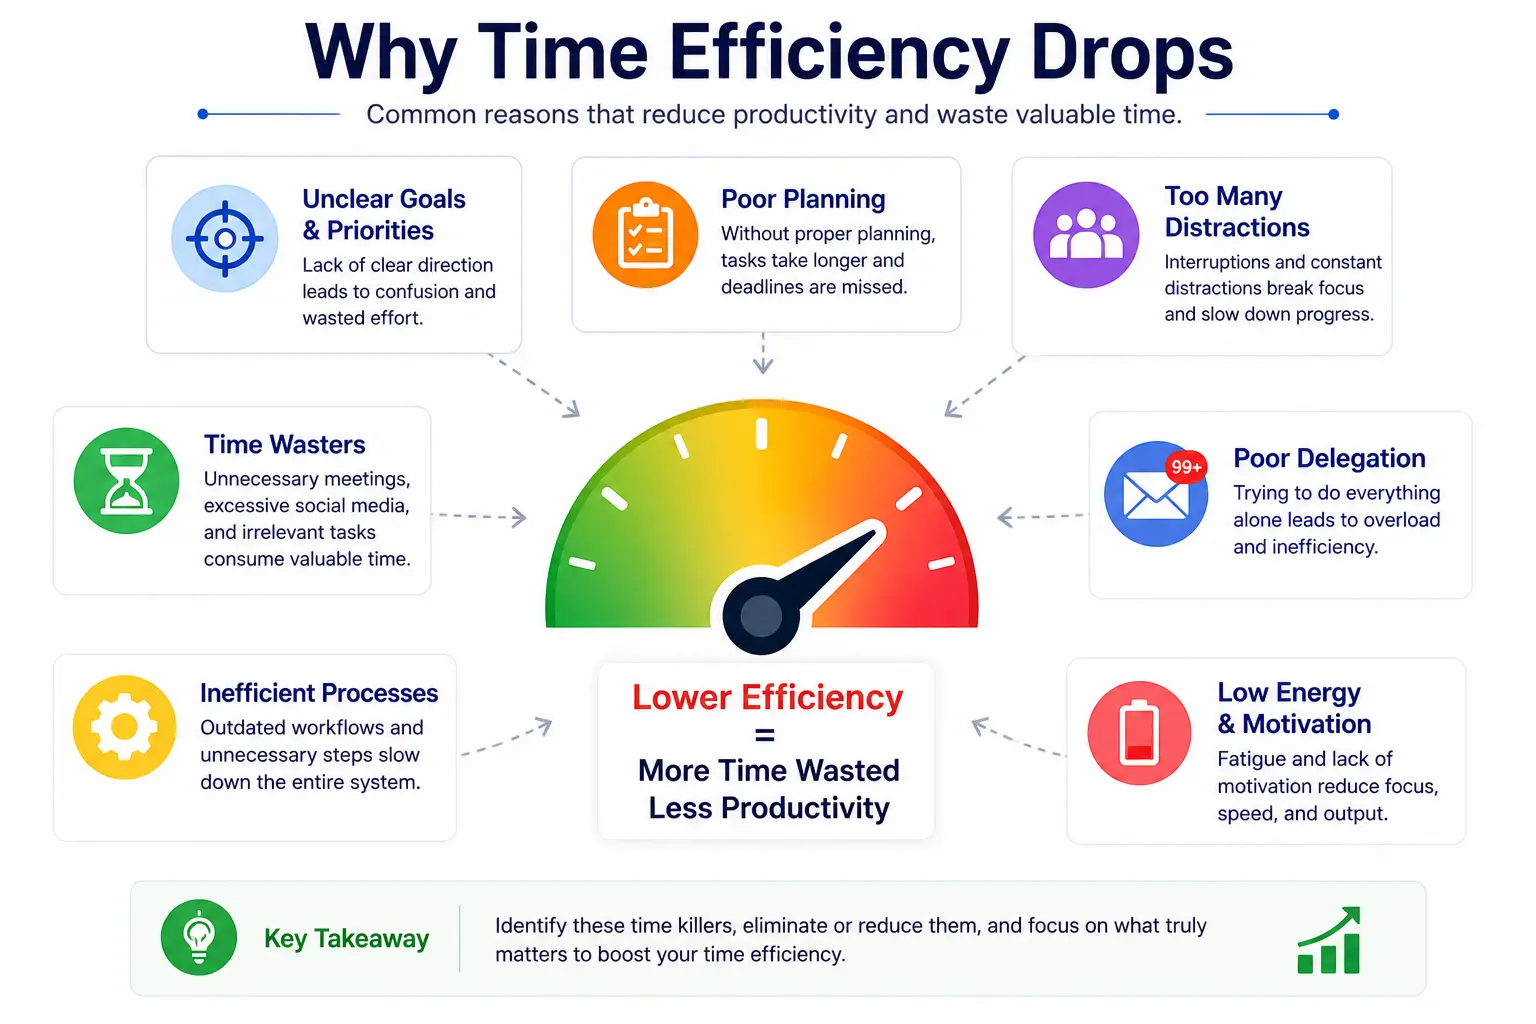
When you first calculate time efficiency and the number is lower than expected, the natural reaction is to treat it as a people problem. In most cases, it isn’t. Before any performance conversation, it’s worth working through the five structural causes that account for the majority of efficiency shortfalls.
1. Unplanned interruptions
Research from the University of California Irvine found that after an interruption, it takes on average 23 minutes to fully return to deep focus. In most office environments, interruptions occur every three to five minutes. If your team’s efficiency sits at 55–65%, this is almost always part of the explanation. Introducing protected blocks of focused work time — even 90 minutes in the morning — consistently shows measurable improvement in efficiency numbers within two to three weeks.
2. Meeting load
A one-hour meeting costs one hour of every attendee’s productive time, plus the transition cost on either side. In many office environments, meetings consume 20–35% of the working week. That alone puts a ceiling on possible time efficiency before anything else is factored in. Running a simple audit of meeting hours against available hours will, in most cases, show you exactly where the floor is — and how much room there is to recover it by cutting or shortening low-value meetings.
3. Unclear priorities
When people aren’t sure what their most important output is, they default to easier, more visible, lower-value work. The hours go in. The meaningful output doesn’t come out. Weekly priority-setting — even a five-minute conversation at the start of each week — is one of the highest-leverage efficiency interventions available to any manager and costs almost nothing to implement.
4. Tool and process friction
Slow software, manual steps that could be automated, redundant approval chains, and unclear handoffs all add non-productive time that accumulates quietly and shows up nowhere in any report — only in your efficiency percentage. If your efficiency has declined quarter-over-quarter with no staffing changes, start here before looking at anything else.
5. Structural demand variability
In shift-based and service environments, some efficiency loss is outside your control. Patient cancellations, retail quiet periods, and uneven customer flow cannot be fully eliminated. The practical response is scheduling flexibility — on-call cover lists, cross-training, and a defined set of useful tasks that fill gaps without creating the appearance of busy work. The goal is to raise the floor, not to pretend variability doesn’t exist.
How to Turn Your Efficiency Number Into Something Actionable
Calculating time efficiency once gives you a number. Calculating it consistently over time gives you a management tool. Here is a straightforward five-step process for making it genuinely useful.
Establish your baseline before making changes. Run the calculation for two full weeks without doing anything differently. Your baseline — not a benchmark — is what you will measure improvement against. Everything else comes after you know where you actually start.
Look for patterns, not just averages. Is efficiency consistently lower on certain days? After particular meeting types? During high-demand periods? Patterns reveal causes. Averages hide them.
Separate what you can control from what you can’t. Some efficiency loss is structural — mandatory compliance tasks, unavoidable meetings, demand variability. Identify that non-negotiable floor first. Then focus improvement on the gap between your floor and your actual average.
Set a realistic target — not an aspirational one. A knowledge-work team moving from 60% to 68% in a quarter is a strong, achievable result. A target of 90% for the same team creates pressure to misreport time rather than genuinely improve it. Targets should stretch performance, not break the measurement system.
Recalculate after every significant change. New tool, restructured meetings, changed shift pattern, new workflow — measure for two weeks after any change and compare directly to your pre-change baseline. That is how you find out what is actually working and what isn’t.
Time Efficiency Calculator vs Other Productivity Tools
Time efficiency is one piece of a larger picture. Depending on your role and what you’re trying to measure, a different tool may give you a more complete answer.
If you work in a clinical or therapy setting — as a PT, PTA, OT, or SLP — the therapy productivity calculator applies the same shift-based logic with role-specific targets and billable hour benchmarks for outpatient, SNF, and hospital environments.
If you manage a field service or technician team and need to measure billable job completion per hour, the technician productivity calculator tracks jobs per hour, revenue per labour hour, and efficiency against a target.
If you need to measure output-per-worker at a department or company level — across revenue, units, or any measurable output — the labor productivity calculator handles individual and group calculations in three output modes.
For a full overview of how time efficiency fits into broader productivity measurement, see the guide to what labor productivity means and how it is applied across industries.
Frequently Asked Questions