Labor productivity shows how much real work gets done for every hour of effort — whether that’s units produced, tasks finished, or revenue generated. Relying on guesswork wastes time and opportunities.
➡️ Try the calculator below, then explore the guide to learn how it works and how to improve performance step by step.
Labor Force Productivity Calculator
With our Labor Productivity Calculator, just a few quick inputs let you measure productivity for individuals, teams, or overall output. It’s fast, simple, and provides clear insights you can act on immediately to make smarter decisions.
The calculator offers three main modes:
- Individual Productivity: Evaluate a single worker’s efficiency based on time, breaks, goals, and actual productive hours.
- Group Productivity: Assess team performance, compare members, and calculate average results.
- Output-Based Productivity: Measure labor productivity in terms of units per hour or revenue per hour, with optional cost-efficiency analysis.
It is designed to be both practical for beginners and powerful for experts, making it suitable for daily monitoring and long-term strategy.

What is Labor Productivity?
Labor productivity is the amount of output produced per unit of labor input, typically expressed as output per labor hour.
The basic formula is simple:
Labor Productivity = Output ÷ Labor Hours
But productivity can be measured in multiple ways:
- Time-Based Productivity: Compares productive hours against total available hours.
- Group Productivity: Averages performance across teams.
- Output Productivity: Links production or revenue directly to labor hours.
Understanding these metrics helps organizations:
- Control labor costs.
- Improve scheduling and workload distribution.
- Set fair performance benchmarks.
- Support growth with data-driven insights.
Pair this tool with others for a full view:
Explore the full suite here: Best Productivity Calculator
What is the Labor Productivity Calculator?
The Labor Productivity Calculator combines different approaches into one unified tool.
It includes two main modes (organized by tabs):
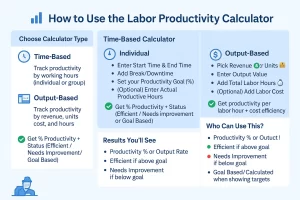
- Time-Based Mode
- Individual: Enter start time, end time, breaks, goals, and productive hours.
- Group: Generate fields for multiple members, enter their working details, and calculate team averages.
- Output-Based Mode
- Switch between Revenue and Units.
- Enter labor hours and output to calculate per-hour productivity.
- Optionally include cost for cost-efficiency results.
This flexibility makes it suitable for managers, supervisors, HR teams, and individual workers who want to measure and improve labor efficiency.
How to Use the Calculator (Step-by-Step)
▸1. Individual Time-Based Productivity
- Input Start Time and End Time.
- Enter Break / Downtime (hours or minutes as your calculator accepts).
- Set a Productivity Goal (%).
- Optionally add Actual Productive Hours to measure real performance.
- Click Calculate.
Example: Employee works 08:00–17:00 with a 1-hour break → 8 effective hours. If 6 hours are productive → Productivity = 75%.
2. Group Time-Based Productivity
- Enter Number of Members (1–20).
- Set the Group Goal (%).
- Click Generate Fields to create per-member input rows.
- For each member, add start/end times, breaks, and productive hours (if available).
- Click Calculate to get the team’s average productivity.
Example: 5 workers, each ~7 effective hours. If 3 report 6 productive hours and 2 report 5, team productivity = (6+6+6+5+5) ÷ (7×5) × 100 = 78.57%.
3. Output-Based Productivity
- Select Revenue or Units as the output measure.
- Enter total Output (e.g., billable revenue or therapy units) and total Labor Hours.
- Optionally enter Labor Cost to see cost efficiency.
- Choose the reporting period (per day / week / month / year).
- Click Calculate to get output per labor hour and cost efficiency.
Example: $60,000 revenue over 1,200 labor hours → $50 / hour. With $15,000 labor cost → $60,000 ÷ $15,000 = $4 revenue per $1 cost.
Understanding the Formula Behind the Calculator ▸
Different modes use different formulas:
1. Individual & Group Productivity
Productivity (%) = (Actual Productive Hours ÷ Effective Hours) × 100
Effective Hours = Total Shift Hours – Breaks
If no actual productive hours are entered, results are goal-based.
Example: 6 ÷ 8 = 75% productivity.
2. Output-Based Productivity
Productivity = Output ÷ Labor Hours
- If measuring revenue: results are in $/hour.
- If measuring units: results are in units/hour.
- With cost entered: Efficiency = Output ÷ Cost.
This approach allows both operational and financial perspectives.
Why Use This Labor Productivity Calculator?
The calculator is valuable because it provides:
- Clarity: Easy-to-read results for individuals and teams.
- Flexibility: Covers both time-based and output-based scenarios.
- KPI Tracking: Productivity is one of the most important labor KPIs.
- Benchmarking: Compare across shifts, teams, or projects.
- Cost Awareness: Optional cost-efficiency metrics for profitability.
- Scalability: Works equally well for small teams or large enterprises.
In short, it transforms labor data into actionable insights.
Expert Tips to Improve Labor Productivity
▸Based on years of productivity consulting, we recommend:
- Invest in training — skill development improves accuracy and speed.
- Streamline workflows — eliminate bottlenecks and wasted motion.
- Adopt technology — small automation tools can save hours each week.
- Encourage communication — teams that share updates avoid duplication.
- Balance workloads — neither overloading nor underutilizing staff.
- Set clear goals — aligned goals increase worker focus.
- Measure frequently — regular tracking ensures steady improvement.
Labor Productivity FAQs
▸- What is labor productivity?
It measures output per labor hour, showing efficiency of workforce use. - How do you calculate it?
Divide total output (units or revenue) by total labor hours. - Can the calculator handle teams?
Yes, the Group Productivity mode supports up to 20 members. - How often should results be tracked?
Weekly or monthly works well, though daily tracking helps for critical projects. - What is a strong productivity rate?
Benchmarks vary, but 70–80% is considered strong in most industries. - Why include both time and output modes?
Because industries differ — some track hours, others track financial or unit output. - How is group productivity calculated?
By averaging percentages across valid member entries. - What does cost efficiency show?
Revenue or units generated per dollar of labor cost. - Is the tool beginner-friendly?
Yes. Inputs are simple, and results are explained clearly. - Can experts use it for KPIs?
Yes. It is designed for benchmarking and strategic planning.
Conclusion
Labor productivity defines efficiency, competitiveness, and growth potential. Measuring it is no longer optional — it is essential (see the U.S. Bureau of Labor Statistics on productivity).
The Labor Productivity Calculator equips individuals, managers, and organizations with a straightforward way to track, analyze, and improve. With regular use, it provides benchmarks, reveals inefficiencies, and supports continuous productivity growth (OECD guide).
📌 Bookmark this tool and integrate it into your workflow. Productivity improvement starts with measurement — and this calculator makes it accessible to everyone.